
Quick Summary
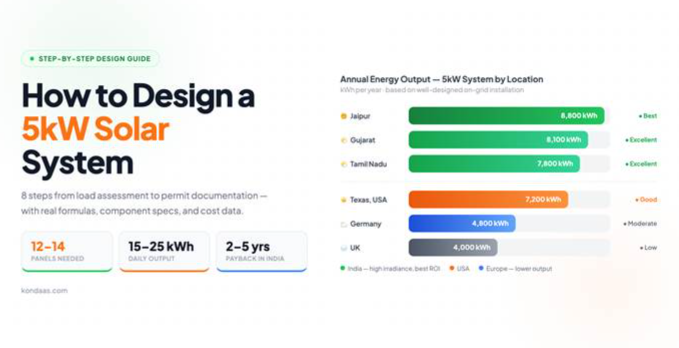
- A 5kW system needs 12–14 solar panels (400W each) or 9–10 panels (550W each)
- It produces 15–25 kWh per day and 6,000–9,500 kWh annually depending on your location
- Eight design steps run from reading your electricity bill to submitting permit documentation
- Tools like professional solar design platforms reduce this process from days to hours
- In India, after central government subsidies, a 5kW on-grid system costs ₹60,000-₹1,00,000
Most homeowners lose money on solar before installation even starts. They get a quote, accept the panel count the installer suggests, and never ask how that number was calculated. A 5kW system designed for the wrong consumption profile, facing the wrong direction, with panels bunched into a shaded corner it’s still called a 5kW system, but it won’t produce 5kW worth of value.
Understanding the design process changes that dynamic. When you know how a 5kW system is sized, sited, and configured, you can evaluate installer proposals with real criteria instead of price alone.
A 5kW solar system is the most widely installed residential size globally. It suits a 3–4 bedroom home consuming 15–25 kWh per day, generates 6,000–9,500 kWh annually depending on location, and hits the economic sweet spot between upfront cost and long-term savings. Designing one correctly involves eight steps: load assessment, site survey, sizing calculations, component selection, panel layout, string design, performance simulation, and permit documentation.
What Is a 5kW Solar System and Who Needs One?
A 5kW solar system has a peak DC output of 5 kilowatts under standard test conditions (STC: 1,000 W/m² irradiance, 25°C cell temperature). In real-world conditions, actual output varies with temperature, cloud cover, soiling, and shading.
Output expectations
| Location | Peak Sun Hours/Day | Daily Output | Annual Output |
| Tamil Nadu, India | 5.0–5.5 | 19–23 kWh | 7,000–8,500 kWh |
| Rajasthan, India | 5.5–6.5 | 22–26 kWh | 8,000–9,500 kWh |
| Gujarat, India | 5.5–6.0 | 21–24 kWh | 7,500–8,800 kWh |
| Phoenix, Arizona | 6.0–6.5 | 23–26 kWh | 8,500–9,500 kWh |
| Texas, USA | 5.0–5.5 | 19–22 kWh | 7,000–8,000 kWh |
| Germany | 3.0–3.5 | 11–14 kWh | 4,000–5,000 kWh |
| United Kingdom | 2.5–3.0 | 9–12 kWh | 3,300–4,400 kWh |
Who a 5kW system suits
A 5kW system works for households consuming 500–750 kWh per month (15–25 kWh per day). That typically means:
- 3–4 bedroom home with standard appliances
- One split AC unit running 6–8 hours daily
- Electric water heater or gas backup
- No electric vehicle (add 2–3 kW for EV charging needs)
If your consumption is above 750 kWh per month, or if you plan to add an EV charger within two years, design for a 6–8 kW system from the start. Retrofitting additional panels later costs significantly more than getting the size right initially.
Check this 5kW Solar Panel Price with Subsidy in India – Complete Cost Breakdown
8-Step Solar System Design Process
Step 1: Assess Your Energy Consumption
The design starts with your electricity bill not with panels, inverters, or installer quotes.
Pull 12 months of electricity bills and record your monthly kWh consumption. Total the 12 months, divide by 365, and you have your daily average. This is the baseline your system must match.
Example: – Annual consumption: 7,300 kWh – Daily average: 7,300 ÷ 365 = 20 kWh/day
Daily average is useful, but the monthly breakdown matters more for system sizing. If your consumption peaks in summer due to air conditioning, size the system against your peak months, not the annual average.
Identify your biggest energy consumers
| Appliance | Wattage | Daily Hours | Daily kWh |
| 1.5-ton split AC | 1,500W | 6 hrs | 9.0 kWh |
| Electric water heater (geyser) | 2,000W | 1 hr | 2.0 kWh |
| Refrigerator | 150W | 24 hrs | 3.6 kWh |
| Ceiling fans (4) | 75W each | 12 hrs | 3.6 kWh |
| LED lighting | 100W total | 6 hrs | 0.6 kWh |
| Washing machine | 500W | 1 hr | 0.5 kWh |
| Television | 120W | 5 hrs | 0.6 kWh |
| Miscellaneous | – | – | 1.5 kWh |
| Total | – | – | ~21.4 kWh/day |
This breakdown also tells you where to reduce consumption if you want to downsize the system. Replacing a 1.5-ton non-inverter AC with a 5-star inverter model typically cuts its energy use by 30–40% – that’s 2.5–3.5 kWh per day saved, which can reduce your required system size by 0.5–1 kW.
Account for future loads
If you plan to add a second AC unit, an electric vehicle charger, or an induction cooktop within the next three years, factor those loads into your design now. Adding them is cheap at the design stage, adding panels after installation is expensive.
EV charging reference: A standard 3.3 kW home EV charger running 4 hours per day adds 13.2 kWh to daily consumption. That alone could justify stepping up from a 5 kW to an 8 kW system.
Step 2: Conduct a Site Assessment
Your roof sets the physical constraints on everything that follows. Site assessment converts theoretical system size into a practical layout.
Roof orientation
In the Northern Hemisphere, south-facing surfaces capture the most annual irradiance. The yield penalty for off-south orientations:
| Orientation | Annual Yield Penalty |
| True south (optimal) | 0% |
| South-southeast / South-southwest | 3–7% |
| Southeast / Southwest | 10–18% |
| East or West | 15–22% |
| North-facing | 25–35% (not recommended) |
For Indian roofs particularly flat terraces common in Tamil Nadu and Kerala — adjustable mounting structures allow south-facing tilt regardless of the building’s orientation. This is frequently the best option for flat-roof installations.
Roof tilt angle
The optimal tilt angle for maximum annual yield is approximately equal to your latitude:
| Latitude Range | Optimal Tilt |
| 8–15° (South India) | 10–15° |
| 15–22° (Central India) | 15–20° |
| 22–30° (North India) | 22–28° |
Pitched roofs in India typically fall between 20–35°, which is close to optimal for most of the country. For flat terraces, 15° tilt structures balance energy production against wind loading.
Shading analysis
Shading is the single most underestimated variable in residential solar design. A shadow on one panel in a string can reduce that entire string’s output by 20–60%, not just the output from the shaded panel alone.
Survey every potential shading source:
- Trees: Account for current height and 10-year growth projection
- Adjacent buildings: Particularly significant in dense urban areas
- Rooftop structures: Water tanks, satellite dishes, chimneys, parapets
- Dormer windows and raised sections of the roof itself
Map shadow positions at three times on December 21 (the winter solstice – worst-case sun angle): – 9:00 AM – 12:00 PM (solar noon) – 3:00 PM
Any roof area receiving more than 2 hours of shade between 9 AM and 3 PM on December 21 is a poor panel location. Plan around these zones rather than placing panels there and hoping for the best.
Available roof area
Measure the usable roof area and subtract: –
Edge setbacks: Typically 50–90 cm from roof perimeters
Ridge exclusion zones: 30–60 cm below the ridge line
Equipment clearances: 60 cm around AC units, vents, and skylights
Safety walkway corridors: Some local codes require 90 cm clear pathways
For a 400W panel measuring 1.72 m × 1.10 m (1.89 m²), 13 panels occupy approximately 24.6 m² of panel area. Add 15–20% for inter-panel gaps and setback losses, and you need 28–30 m² of clear roof space.
Structural assessment
Roof-mounted solar panels add 12–20 kg/m² of distributed load to the roof structure. Most reinforced concrete roofs (common in India) handle this easily. For older or lighter structures, have a structural engineer confirm load capacity before finalizing the design.
Step 3: Calculate Your Solar Panel Requirements
With consumption and site data confirmed, the sizing calculation determines how many panels you actually need.
Peak sun hours
Peak sun hours (PSH) measure the equivalent number of hours per day that solar irradiance averages 1,000 W/m² the standard test condition. A location with 5 PSH receives the same total daily irradiance as 5 full hours of perfect test-condition sunlight, even if the actual sun is present for 12 hours at varying intensity.
You can look up your location’s PSH from irradiance databases. For India, the National Institute of Solar Energy (NISE) publishes state-level data, and the NREL Global Solar Atlas provides free city-level irradiance maps.
The system sizing formula
System Size (kWp) = Daily Consumption (kWh) ÷ Peak Sun Hours ÷ System Efficiency
System efficiency accounts for all real-world losses: inverter losses, temperature derating, wiring resistance, soiling, and shading. A well-designed on-grid system achieves 75–82% efficiency. Use 0.78 as a conservative starting point.
Worked example: – Daily consumption: 20 kWh – Peak sun hours (Chennai, Tamil Nadu): 5.1 – System efficiency: 0.78
System Size = 20 ÷ 5.1 ÷ 0.78 = 5.03 kWp → round to 5 kW
Panel count calculation
Number of Panels = System Size (W) ÷ Panel Wattage (rounded up)
| Panel Wattage | Calculation | Panels Required | Roof Area |
| 300W | 5,000 ÷ 300 = 16.7 | 17 panels | ~35 m² |
| 380W | 5,000 ÷ 380 = 13.2 | 14 panels | ~27 m² |
| 400W | 5,000 ÷ 400 = 12.5 | 13 panels | ~26 m² |
| 440W | 5,000 ÷ 440 = 11.4 | 12 panels | ~23 m² |
| 550W | 5,000 ÷ 550 = 9.1 | 10 panels | ~20 m² |
For space-constrained roofs, 440–550W panels reduce the footprint by 20–25% compared to 300W panels. The cost per panel is higher, but the total installed cost difference is often modest.
Design margin
Add a 10–15% design margin on top of your calculated system size to account for panel degradation over time (0.5–0.7% per year), future consumption growth, and real-world performance below the simulation estimate. A household needing exactly 5.0 kW today should design for 5.5 kW.
Step 4: Choose the Right System Components
Component selection determines system reliability, longevity, and performance. Every component choice affects the others, so evaluate them as a system.
Solar panels
Monocrystalline silicon panels are the standard for residential 5kW systems in 2026. Their efficiency range:
| Technology | Efficiency | Notes |
| Mono PERC | 20–22% | Most widely available, proven track record |
| N-type TOPCon | 22–25% | Better low-light performance, lower temperature coefficient |
| N-type HJT | 22–24% | Excellent temperature coefficient, higher cost |
| Polycrystalline | 15–18% | Lower efficiency, rarely specified for new installations |
For Indian conditions – high ambient temperatures, significant dust N-type TOPCon panels offer a meaningful performance advantage over PERC in hot climates. The temperature coefficient for TOPCon panels is typically -0.30%/°C versus -0.35%/°C for PERC. At 45°C ambient (common in Rajasthan summers), that’s an additional 1.25% output advantage.
Key specifications to compare:
- Power output warranty: Minimum 25 years at ≥80% rated output
- Product warranty: 12–15 years minimum
- Temperature coefficient (Pmax): Lower is better. Look for -0.35%/°C or lower
- Nominal Operating Cell Temperature (NOCT): Lower is better. Industry average is 43–47°C
- Certification: IEC 61215, IEC 61730 are mandatory
Inverter
The inverter converts DC power from your panels to AC power your home uses. It also manages grid connection, protection functions, and monitoring.
String inverters are the standard choice for unshaded rooftops. A single unit handles all panels. Well-regarded manufacturers for the Indian market include:
- Solis: Strong after-sales support across India, competitive pricing
- Growatt: Popular in the sub-10kW residential segment
- SMA (Germany): Premium quality, longer warranty, higher upfront cost
- Fronius (Austria): Known for monitoring quality and long inverter life
Avoid unknown-brand inverters, regardless of price. Inverter failure typically happens in year 3–7, when the savings from the cheap inverter are long spent and a replacement costs ₹25,000–₹40,000.
Sizing rule: The inverter’s AC output should be 80–120% of the total DC array capacity. For a 5.5 kWp array (with design margin), specify a 5 kW or 6 kW inverter. Slight undersizing (5 kW inverter with 5.5 kWp panels) is a legitimate optimization that limits peak output but captures more energy during moderate irradiance periods.
Microinverters – individual units per panel make sense when 20% or more of your array faces partial shading. They eliminate the weakest-panel problem inherent in string wiring. The cost premium is roughly 15–25% over a string inverter system.
Hybrid inverters manage both panels and battery storage in one unit. Worth specifying if battery storage is in your 3-year plan retrofitting battery capability to a string-only inverter later often means replacing the inverter entirely.
Charge controller (off-grid systems only)
For off-grid 5kW systems, specify an MPPT (Maximum Power Point Tracking) charge controller. MPPT controllers harvest 20–30% more energy from the array than PWM (Pulse Width Modulation) controllers, particularly under partial shading and early-morning/late-afternoon conditions.
Size the controller to handle the full array current with 25% headroom: – 5kW at 40V = 125A → specify a 150A MPPT controller
Battery storage
Grid-tied systems don’t require batteries. For backup power or off-grid operation:
LiFePO4 (LFP) chemistry is the correct choice for a residential 5kW system. Compared to lead-acid alternatives:
| Specification | LiFePO4 (LFP) | Lead-Acid (VRLA) |
| Cycle life | 3,000–5,000 cycles | 300–500 cycles |
| Depth of discharge | 80–95% | 50% |
| Round-trip efficiency | 95–97% | 75–85% |
| Weight (per kWh) | 8–10 kg | 25–30 kg |
| 10-year cost per kWh stored | Lower | Higher |
Battery capacity requirements by use case:
| Use Case | Battery Size |
| Essential backup (fans, lights, phone charging – 4 hrs) | 5–8 kWh |
| Standard backup (fans, lights, refrigerator – 6 hrs) | 8–12 kWh |
| Partial off-grid (daytime self-sufficiency) | 10–15 kWh |
| Full off-grid (energy independence) | 20–30 kWh |
Check this Lithium-ion batteries deliver long service life, fast charging, and zero maintenance.
For Tamil Nadu and Kerala homeowners dealing with 4–8 hour daily outages, an 8–12 kWh LFP battery covers essential loads through the outage period and recharges fully from the 5kW array the following day.
Monitoring system
Every quality inverter includes a web portal and app for monitoring daily production. Beyond this baseline, look for:
- String-level monitoring: Shows individual string performance, making fault isolation faster
- Export limiting: Controls how much excess power is exported to the grid (required by some DISCOMs)
- Remote access and alerts: SMS or app notification when production drops below threshold
- Historical data export: For annual performance reviews and warranty claims
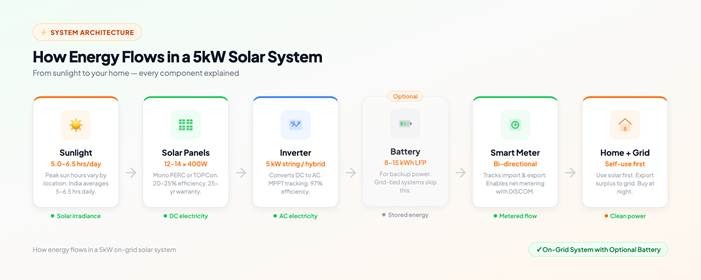
Energy flows from solar panels through the inverter, smart meter, and into your home and grid.
Step 5: Design the Panel Layout
Panel layout determines which roof areas capture sunlight, how panels are grouped into strings, and how energy flows to the inverter. Two systems with identical components can differ by 15–20% in annual output based on layout decisions.
Orientation and tilt optimization
For pitched roofs, place all panels on the south-facing face. If south faces are unavailable or insufficient, use an east-west split: – Morning production: east-facing panels (6 AM–12 PM peak) – Afternoon production: west-facing panels (12 PM–6 PM peak)
East-west split systems reduce peak output but flatten the daily production curve, which can reduce grid export and increase self-consumption.
For flat terraces, east-west racking (panels tilted facing east and west in alternating rows) allows higher panel density than south-facing rows, because inter-row spacing requirements are lower. Total annual yield is comparable to south-facing on-flat when panel count is maximized.
Inter-row spacing
- For south-facing rows on a flat or low-pitch surface, inter-row shading between rows on winter mornings is the key spacing constraint.
- A practical rule of thumb: space rows so the front edge of the rear row’s shadow falls no further than 60% up the face of the rear row at 9 AM on December 21. The actual calculation:
Minimum Spacing = Panel Height × sin(tilt angle) ÷ tan(winter solar altitude at 9 AM)
For Chennai (latitude 13°N) at 15° tilt: – Panel height × sin(15°) = 1.72 × 0.259 = 0.45 m (shadow height) – Solar altitude on Dec 21 at 9 AM ≈ 28° – Minimum spacing = 0.45 ÷ tan(28°) = 0.45 ÷ 0.532 = 0.85 m between row rear edge and next row front edge
Layout software
Manual layout calculations work for simple, single-surface rooftops. For multi-face roofs, flat terraces with obstructions, or any site where string assignments need to be optimized alongside layout, purpose-built software reduces errors and generates permit-ready documentation automatically.
SurgePV handles 3D roof modeling, panel placement, shading analysis, and string assignment in a single platform. Solar installers across 50+ countries use it to reduce the layout-to-permit workflow from two days of manual work to under two hours. For homeowners reviewing installer proposals, a SurgePV-generated design report includes the layout diagram, panel count justification, and string configuration the three elements that most determine whether a proposed system will perform as promised.
Step 6: Configure Your String Design
String design connects panels in series and parallel to match the inverter’s DC input requirements. Get this wrong and the inverter either trips, underperforms, or in extreme cases sustains damage.
Series and parallel connections
- Series connection (end-to-end): Voltage adds up, current stays the same. – 13 panels × 40.2V (Vmp) = 522.6V string voltage – Current = single panel Imp (typically 9–12A)
- Parallel connection (side-by-side): Current adds up, voltage stays the same. – Two strings of 6 panels: voltage = 6 × 40.2V = 241.2V – Current = 2 × panel Imp
Inverter MPPT requirements
Your inverter has three critical voltage parameters:
- Voc max: Maximum open-circuit voltage the inverter can accept (typically 1000V or 1500V)
- MPPT range: Voltage window where the inverter tracks maximum power (e.g., 200–800V)
- Start voltage: Minimum voltage to begin operation (typically 120–150V)
String sizing must satisfy all three conditions across the full operating temperature range.
Temperature correction (critical step):
Panel voltage increases at low temperatures. At -10°C, panel Voc may be 10–15% higher than the STC value. At 70°C cell temperature (common in Indian summers), Vmp drops by 15–20%.
Cold temperature check (safety): > Max string voltage = Voc_STC × (1 + temperature coefficient_Voc × (Tmin – 25°C))
For a panel with Voc = 48V and temperature coefficient of -0.28%/°C, at 0°C (minimum for most of South India): > Max string Voc = 48 × (1 + 0.0028 × (0 – 25)) = 48 × 0.93 = 44.6V per panel
13 panels in series: 44.6 × 13 = 579.8V – safely below a 1000V inverter maximum.
Hot temperature check (MPPT efficiency): > Min MPPT voltage = Vmp_STC × (1 + temperature coefficient_Vmp × (Tmax – 25°C))
At 70°C cell temperature, with Vmp coefficient of -0.35%/°C: > Operating Vmp = 40.2 × (1 + 0.0035 × (70 – 25)) = 40.2 × 0.842 = 33.8V per panel
13 panels: 33.8 × 13 = 439.4V – must stay within the inverter’s MPPT range.
String configuration options for a 13-panel 5kW system
| Configuration | Strings | Panels per String | String Voltage (STC) | Notes |
| Single string | 1 | 13 | ~522V | Simple, uniform roof required |
| Dual string (two MPPT) | 2 | 7 + 6 | ~281V / ~241V | Use for different orientations |
| Dual string + optimizers | 2 | 7 + 6 | Varies | Use for partial shading |
When panels face two different roof orientations, put each orientation on a separate MPPT input. Mixing different orientations in a single string forces the lower-voltage orientation to drag down the higher-voltage one.
Module-level power electronics
When shading is unavoidable, power optimizers (SolarEdge system) or microinverters (Enphase system) eliminate the weakest-link problem. Each panel operates at its own maximum power point regardless of neighboring panels’ conditions.
The cost premium: ₹12,000–₹20,000 extra for a 13-panel system. Worthwhile when shading losses exceed 10% of annual production.
Step 7: Run a Performance Simulation
No design is final until the simulation validates it. A proper energy yield simulation shows annual production month by month, identifies the dominant loss factors, and confirms the system meets your consumption target.
What simulation covers
Annual yield: Expected kWh per year, based on location-specific irradiance data from a typical meteorological year (TMY) database.
Performance ratio (PR): Actual yield divided by theoretical yield. A well-designed 5kW residential system should achieve PR of 75–85%. Below 70% indicates design problems.
Loss breakdown: Where energy disappears between panels and your meter:
| Loss Factor | Typical Range | What Affects It |
| Irradiance loss (shade, soiling) | 2–15% | Shading analysis quality |
| Temperature loss | 5–10% | Climate, panel temperature coefficient |
| Inverter conversion loss | 2–5% | Inverter efficiency rating |
| DC wiring loss | 1–3% | Cable sizing, connection quality |
| AC wiring loss | 0.5–1.5% | Cable routing, distance to panel |
| Module quality | 1–3% | Panel degradation, tolerance |
| Total losses | 12–30% | Design and climate dependent |
Running the simulation
Using a professional solar design software platform:
- Input site coordinates – irradiance data loads automatically from the nearest weather station
- Define roof geometry and panel positions from the layout step
- Assign panel and inverter models from the product library
- Set system parameters: DC cable length and gauge, AC distance to meter
- Run annual simulation using TMY irradiance data
- Review output: total kWh/year, monthly production chart, and loss waterfall diagram
Expected annual output for a well-designed 5kW system
| Location | Annual Output | PR Range | Notes |
| Chennai, Tamil Nadu | 7,400–8,200 kWh | 79–84% | High irradiance, dust soiling |
| Ahmedabad, Gujarat | 7,800–8,700 kWh | 80–85% | Excellent solar resource |
| New Delhi | 7,200–8,000 kWh | 78–83% | Summer haze, winter fog |
| Mumbai | 6,800–7,500 kWh | 77–82% | Monsoon season losses |
| Jaipur, Rajasthan | 8,200–9,200 kWh | 81–86% | India’s best solar resource |
| Bangalore | 7,000–7,800 kWh | 79–84% | Moderate irradiance, low temperatures |
Adjusting based on simulation results
If annual yield falls short of your consumption target: – Add panels (preferred – cheapest fix) – Increase tilt angle toward optimal – Eliminate shading (tree trimming, structure relocation) – Switch to higher-efficiency panels
If yield exceeds consumption by more than 20%, either scale back panel count or size up battery storage to capture the surplus.
The simulation also validates the string configuration checking that voltage and current values stay within inverter specifications across the full range of modeled temperatures.
Cross-check with free tools
For a quick sanity check on your installer’s simulation, use the NREL PVWatts Calculator a free online tool from the National Renewable Energy Laboratory. Enter your city, system size, tilt, and azimuth, and it returns an annual kWh estimate based on long-term weather data. If your installer’s simulation is more than 15% above the PVWatts estimate, ask for an explanation of the difference.
Step 8: Prepare Your Permit Documentation
A complete permit set for a 5kW rooftop solar system includes electrical documentation, structural calculations, and utility interconnection paperwork. In India, the exact requirements vary by state and DISCOM, but the core documents are consistent.
Electrical documentation
Single-line diagram (SLD): Shows the electrical path from panels to grid connection strings, combiner box (if used), DC disconnect, inverter, AC disconnect, bi-directional meter, and utility connection point. Most DISCOMs require a stamped SLD from a licensed electrical engineer.
String configuration diagram: Panel count, series/parallel arrangement, string fuse ratings, DC wire gauge and conduit type.
Equipment specifications: Datasheets for panels, inverter, mounting hardware, and all protection equipment.
Structural documentation
Roof load calculations: Dead load from panels and racking per square meter, distributed across roof structural members.
Attachment details: Mounting method L-foot clamps with chemical anchors for RCC roofs, standard L-feet for tiled roofs, ballasted frames for flat terraces where penetrations aren’t permitted.
Wind load certification: Racking systems for India should comply with IS 875 Part 3 for wind loading. Most reputable mounting manufacturers provide pre-certified load calculations for their racking systems.
DISCOM interconnection application
For grid-tied systems with net metering, submit an interconnection application to your state DISCOM before installation begins. Key documents typically required:
- Completed application form (available from DISCOM website)
- System design drawings (SLD + layout)
- Inverter and panel specifications
- Applicant’s electricity consumer number and latest bill
- Site plan showing roof area and meter location
India-specific timeline: TANGEDCO (Tamil Nadu) and KSEB (Kerala) process net metering applications in 4–12 weeks under current workloads. Submit the application as soon as your design is finalized, not after installation.
PM Surya Ghar Muft Bijli Yojana portal: New rooftop solar applications in India are centralized at pmsuryaghar.gov.in. Register through the portal before installation to ensure your system qualifies for the central subsidy. The portal also manages the subsidy disbursement directly to the installer.
5kW Solar System Costs: A Realistic Breakdown
Cost varies significantly by location, installer quality, and component selection. Here are realistic figures for India and international markets.
India: On-Grid 5kW Solar System (2026)
| Component | Specification | Price Range |
| Solar panels | 13 × 400W mono PERC | ₹55,000–₹75,000 |
| Grid-tied inverter | 5 kW, reputable brand | ₹25,000–₹45,000 |
| Aluminum mounting structure | Ground or roof mount | ₹18,000–₹30,000 |
| DC/AC cables and protection | Wiring, MCBs, earthing | ₹12,000–₹20,000 |
| Bi-directional net meter | DISCOM-approved | ₹3,000–₹6,000 |
| Installation labor | Roof work, commissioning | ₹15,000–₹25,000 |
| Total before subsidy | ₹1,28,000–₹2,01,000 |
PM Surya Ghar central subsidy for 5kW: – First 3 kW: ₹30,000/kW = ₹90,000 – Next 2 kW: ₹18,000/kW = ₹36,000 – Total central subsidy: ₹1,26,000
Net cost after central subsidy: ₹2,000–₹75,000 depending on installer pricing. Additional state subsidies (available in states like Gujarat, Maharashtra, and Rajasthan) reduce this further.
Note: Always verify current subsidy amounts directly on pmsuryaghar.gov.in subsidy structures change with government budget cycles.
India: Off-Grid / Hybrid 5kW Solar System
Adding a 10 kWh LFP battery bank adds ₹80,000–₹1,20,000 to the system cost. A hybrid inverter (replacing the standard grid-tied unit) adds another ₹15,000–₹30,000. Total system cost for a 5kW hybrid with 10 kWh battery: ₹2,50,000–₹3,50,000 before subsidies.
USA: 5kW Residential Solar System
According to EnergySage market data, the average installed cost of a 5kW system in the United States is approximately $13,550 ($2.71/W) before incentives. State-level incentives vary, check your state energy office for current programs.
Note: The 30% federal residential clean energy credit (Section 25D) expired on December 31, 2025, for new installations.
Hidden costs to verify
Before signing a contract, confirm whether the quote includes: – DISCOM application fees and meter installation costs – Structural engineer sign-off (required by some DISCOMs) – Extended warranty on inverter (beyond standard 5-year) – Annual maintenance contract (cleaning, inspection) – Monitoring platform subscription (some brands charge after year 1)
Expected Energy Output and Return on Investment
How to calculate your actual savings
Savings depend on three variables: how much the system produces, how much of that production replaces grid electricity you would have paid for, and what the grid electricity rate is.
For net-metered systems, any surplus production is exported to the grid at a feed-in tariff rate (typically lower than the retail rate you pay for grid electricity). The calculation:
Annual Savings = (Self-Consumed kWh × Retail Rate) + (Exported kWh × Feed-in Tariff)
India example (Chennai, TANGEDCO domestic tariff): – Annual production: 8,000 kWh – Self-consumption (70%): 5,600 kWh × ₹6.50 = ₹36,400 – Grid export (30%): 2,400 kWh × ₹2.25 (TANGEDCO export rate) = ₹5,400 – Total annual savings: ₹41,800 – Net system cost (after subsidy): ₹70,000 – Simple payback: 70,000 ÷ 41,800 = 1.7 years
US example (Texas, average retail rate $0.14/kWh): – Annual production: 7,500 kWh – Self-consumption (60%): 4,500 kWh × $0.14 = $630 – Grid export (40%): 3,000 kWh × $0.08 (net metering rate) = $240 – Total annual savings: $870 – System cost (no federal credit): $13,550 – Simple payback: 15.6 years
The difference between Indian and US payback periods reflects India’s high electricity tariff, significant central subsidies, and strong solar irradiance.
25-year return projection
| Year | Cumulative Savings (India Example) |
| Year 1 | ₹41,800 |
| Year 2 | ₹83,600 |
| Year 3 | ₹1,25,400 (breakeven if net cost ₹1,00,000) |
| Year 5 | ₹2,09,000 |
| Year 10 | ₹4,18,000 |
| Year 15 | ₹6,27,000 |
| Year 25 | ₹10,45,000 |
This excludes electricity tariff increases (historically 4–7% annually in India), which would accelerate payback and increase returns. It also excludes panel degradation (0.5%/year), which has a modest negative effect.
On-Grid, Off-Grid, or Hybrid: Which System Type Should You Choose?
Most residential 5kW systems in India should be on-grid with net metering. The exceptions are real, but they’re exceptions.
| Factor | On-Grid | Off-Grid | Hybrid |
| Battery required | No | Yes (20–30 kWh) | Optional (8–15 kWh) |
| Works during grid outage | No | Yes | Yes (battery sized) |
| Cost (relative) | Baseline | +50-80% | +20-40% |
| Net metering eligible | Yes | No | Yes |
| DISCOM approval needed | Yes | No | Yes |
| Best for | Urban/suburban with grid access | Remote locations, no grid | Urban areas with frequent long outages |
When off-grid makes sense: Remote agricultural land, construction sites, or properties where grid connection cost exceeds ₹3,00,000 (common for locations more than 2 km from the nearest distribution line).
When hybrid makes sense: Urban or semi-urban locations with more than 6 hours of daily grid outages. A 10 kWh battery connected to a hybrid inverter covers essential loads (fans, lights, refrigerator) through a standard outage, charges from the solar array during the day, and still exports surplus to the grid.
The cost of backup: An 8 kWh LFP battery adds ₹60,000-₹90,000 to the system cost and roughly 12–18 months to the payback period. Whether that’s worth it depends on your local outage frequency and what you lose when the power goes out.
Common 5kW System Design Mistakes
These errors consistently reduce system performance below expectations. All are avoidable at the design stage.
Sizing to average consumption, not peak months. A system sized to your 12-month average will fall short during peak summer months when AC runs heaviest. Size to your highest 3-month average and add a 10% buffer.
Skipping the December 21 shading check. Shading problems invisible in summer become severe in winter when the sun is 20–30° lower in the sky. A professional design always includes a winter solstice shading analysis.
Mixing panels from different orientations in one string. East-facing and west-facing panels generate different voltages throughout the day. Connecting them in a single string forces the inverter to operate at the lower-performing panel’s voltage point, wasting production from the better-oriented panels. Separate strings for each orientation.
Choosing the cheapest inverter. Inverter failures are the most common cause of system downtime. Budget models from manufacturers without India service networks can mean waiting months for warranty support. The price difference between a tier-3 and tier-1 inverter is typically ₹5,000–₹15,000 a poor place to save on a ₹1,50,000 installation.
Installing with no monitoring. A single loose DC connection or failed bypass diode can reduce output by 10–15% for months or years without being noticed. Any system without monitoring is operating on hope.
Ignoring temperature coefficients in hot climates. A panel rated at 400W produces 365W at 45°C ambient (cell temperature ~70°C) with a -0.35%/°C coefficient. Over an Indian summer, this is not a minor correction; it’s 9% of rated output that many installers don’t account for in yield projections.
Conclusion
Designing a 5kW solar system comes down to eight sequential decisions: establish your daily consumption from 12 months of bills, assess your roof’s orientation and shading, calculate the required array size with a realistic efficiency factor, select components that work as a system, design a layout that maximizes yield while respecting setbacks, configure strings that stay within inverter voltage limits across all temperatures, run a simulation that validates the design against local irradiance data, and prepare permit documentation that satisfies your DISCOM and local authority requirements.
Three things you can do this week:
- Pull your electricity bills for the past 12 months and calculate your average monthly kWh. That single number drives every subsequent design decision.
- Ask any installer for their simulation results before agreeing to a proposal specifically the expected annual kWh output and performance ratio. If they can’t provide these, the design hasn’t been done properly.
- Check the PM Surya Ghar portal (pmsuryaghar.gov.in) to confirm current subsidy amounts for your state before finalizing costs. The central subsidy structure changes, and many quotes use outdated figures.
A correctly designed 5kW system in Tamil Nadu or Kerala pays for itself in under 2 years after subsidies and generates returns for 25 years. Getting the design right is the part that’s entirely within your control.
Frequently Asked Questions
-
How many solar panels do I need for a 5kW system?
A 5kW system needs 12–14 panels at 400W each, or 9–10 panels at 550W each. Divide 5,000 watts by your chosen panel’s wattage and round up to the next whole number. For a 380W panel: 5,000 ÷ 380 = 13.2, so 14 panels. Panel count also depends on whether you include a design margin a 5.5 kWp array with 14 × 400W panels accounts for future degradation and adds a production buffer.
-
How much electricity does a 5kW solar system produce per day in India?
Most locations in India produce 19–26 kWh per day from a well-designed 5kW system. Rajasthan and Gujarat see the high end (24–26 kWh) due to exceptional irradiance. Tamil Nadu and Kerala average 19–23 kWh. Mumbai and coastal areas produce 18–21 kWh due to higher humidity and monsoon cloud cover losses.
-
What is the cost of a 5kW solar system in India after subsidies?
Before subsidies, a 5kW on-grid system costs ₹1,28,000–₹2,01,000 depending on components and installer. The PM Surya Ghar central subsidy for 5kW works out to ₹1,26,000. After applying the central subsidy, the effective cost is ₹2,000–₹75,000. Some states add additional subsidies on top of the central amount.
-
Can a 5kW solar system power an entire home?
Yes, for most homes consuming 500–700 kWh per month. A 5kW system in Tamil Nadu produces approximately 7,500–8,500 kWh annually enough to fully offset electricity consumption for a 3–4 bedroom household with one AC unit. Homes with higher consumption (two AC units, electric water heating, EV charging) benefit from a 6–8 kW system.
-
What happens to my solar system when the power goes out?
A standard grid-tied on-grid system shuts down automatically during grid outages. This is a safety feature required by regulations it prevents your system from back-feeding power into lines where utility workers may be making repairs. Hybrid systems with battery storage continue to supply power to your home during outages, up to the battery’s storage capacity.
-
How long does a 5kW solar system last?
Solar panels carry a 25-year performance warranty guaranteeing at least 80% of rated output at year 25. In practice, panels regularly perform above warranty minimums most degrade at 0.5–0.7% per year. Inverters last 10–15 years. Plan for one inverter replacement over the system’s 25-year life. With routine maintenance (annual cleaning, quarterly inspection), a 5kW system installed today will still be producing meaningful power in 2050.
-
How do I choose between a string inverter and a hybrid inverter?
Choose a string inverter if you have no shading issues and no immediate plans for battery storage. It’s cheaper and well-proven. Choose a hybrid inverter if you plan to add battery backup within 3–5 years retrofitting battery capability to a string-only inverter later often means replacing the entire inverter. The hybrid inverter costs ₹10,000–₹25,000 more upfront, but avoids a larger retrofit cost later. If you have partial shading on more than 15% of panels, consider microinverters regardless of battery plans.
-
Is a 5kW solar system enough for an electric vehicle?
It depends on your driving habits. A typical EV covering 15,000 km per year consumes 2,500–3,500 kWh. A 5kW system producing 8,000 kWh annually leaves 4,500–5,500 kWh for household use after charging the EV which covers a moderate household’s remaining consumption. Heavier drivers or households with two vehicles should plan for a 7–8 kW system.